

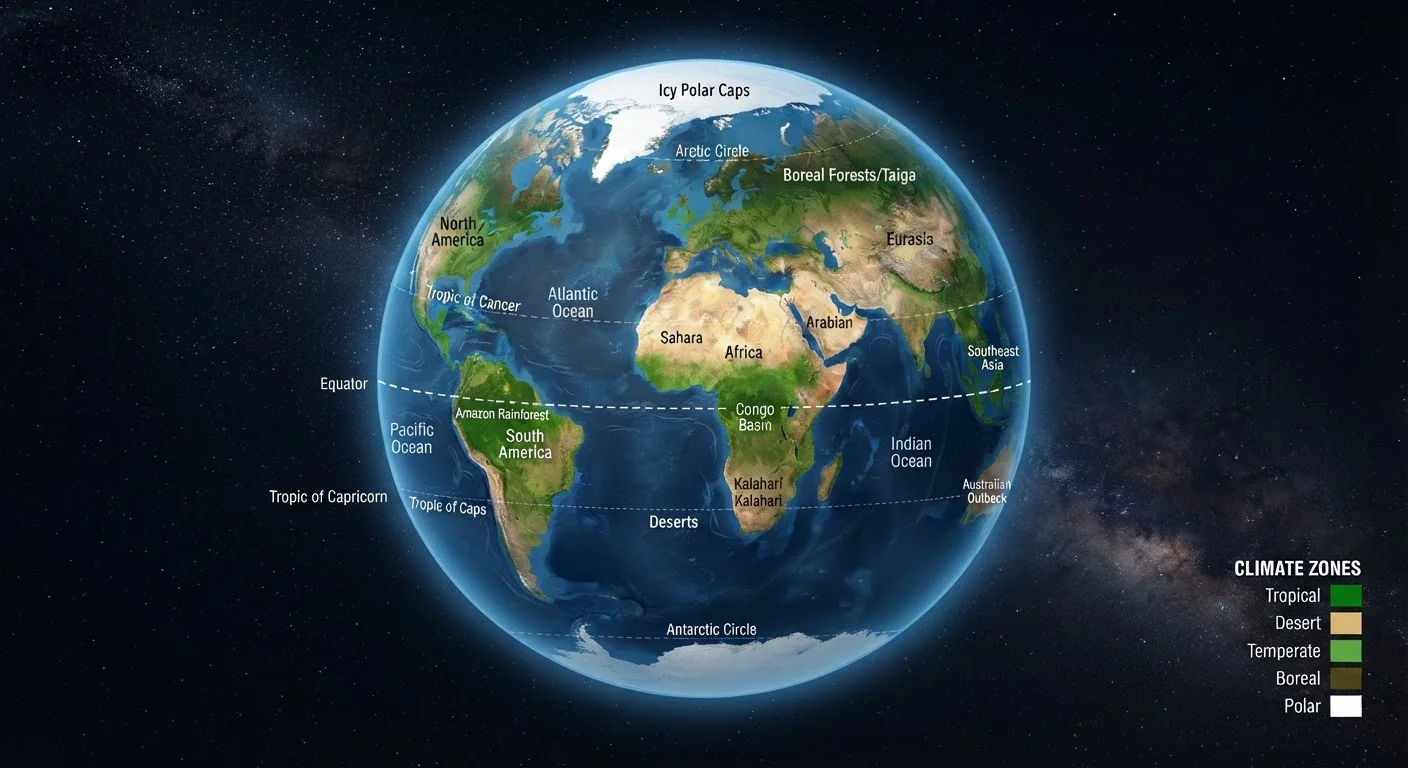
How Scientists Classify Earth's Climates
Climate zones are broad geographic regions defined by long-term patterns of temperature, precipitation, and seasonality - not day-to-day weather. The most widely used framework is the Köppen climate classification, developed by German-Russian climatologist Wladimir Köppen in the early 20th century and refined by Rudolf Geiger. It groups Earth's land surface into five major zones, each designated by a letter: A (tropical), B (dry), C (temperate), D (continental), and E (polar).
Understanding these zones helps explain why rainforests, deserts, grasslands, and tundra exist where they do - and why agriculture, biodiversity, and human settlement patterns look so different across latitudes. If you're new to the vocabulary, our climate science glossary covers foundational terms used throughout this guide. And for a broader primer, see Climate Science for Beginners.
The Five Zones, Explained
A - Tropical Zone
Found within roughly 15-25° of the equator, tropical climates receive intense solar radiation year-round. Average temperatures stay above 64°F (18°C) every month, and annual rainfall often exceeds 60 inches. The Amazon Basin, Central Africa, and Southeast Asia fall here. Sub-types include the tropical rainforest (year-round rain), tropical monsoon (heavy seasonal rain), and tropical savanna (distinct wet and dry seasons).
B - Dry Zone
Dry climates are defined not by temperature but by moisture deficit - evaporation consistently exceeds precipitation. Deserts (BWh, BWk) and semi-arid steppes (BSh, BSk) together cover roughly 30% of Earth's land surface, making this the most extensive zone by area. The Sahara, Arabian Peninsula, and interior Australia are prominent examples.
C - Temperate Zone
Temperate climates have distinct seasons but no month averaging below −3°C (27°F). They support some of the world's most productive agricultural land and densest human populations. Subtypes range from Mediterranean (dry summers, wet winters - coastal California, southern Europe) to humid subtropical (hot summers, mild winters - the U.S. Southeast) and oceanic (cool, rainy - the Pacific Northwest, western Europe).
D - Continental Zone
Continental climates are characterized by extreme seasonal swings, cold winters (at least one month below −3°C), and warm to hot summers. They are found only in the Northern Hemisphere - North America's interior, Russia, and northeastern China - because the Southern Hemisphere lacks sufficient landmass at those latitudes. Snowfall is significant and ecosystems include boreal forests (taiga) and temperate grasslands.
E - Polar Zone
In polar climates, no month averages above 10°C (50°F). The tundra subtype sees brief summers where surface soil thaws; the ice cap subtype (EF) never rises above freezing. Greenland and Antarctica represent the extreme end. These regions store enormous quantities of frozen water, making them highly sensitive indicators of global temperature change. For context on how scientists distinguish natural variability from human-driven shifts in these zones, see how attribution science works.
Why Zone Boundaries Shift - and Why It Matters
Climate zone boundaries are not fixed lines on a map. They shift in response to oceanic circulation, elevation, and long-term climate trends. A mountain range can compress several zones into a few miles of vertical relief - the Rocky Mountains, for example, pass through temperate, continental, and near-polar conditions from base to summit.
Over decades, researchers have documented measurable poleward migration of climate zone boundaries. A peer-reviewed study published in Nature Climate Change found that the tropical belt widened by roughly 0.5-1° of latitude per decade during the late 20th century, compressing mid-latitude temperate zones. This matters for agriculture, water supply, and species ranges - not just academic classification.
It's also worth distinguishing climate from weather: a single cold snap in a subtropical region doesn't reclassify it. As explained in our companion piece Climate vs. Weather, climate is the 30-year average; weather is what happens on any given Tuesday.
If you're planning travel across different zones, practical implications - from what to pack to health precautions - vary dramatically. Our regional packing guide covers conditions across major American climate regions.
Zone Maps Are Models, Not Hard Borders
Published Köppen climate maps use 30-year climate normals (typically from weather station data) to assign each grid cell to a zone. The boundaries you see on maps represent statistical averages, not ecological walls. Local factors like coastal proximity, elevation, and soil type can create microclimates that differ significantly from the surrounding zone - a valley floor may behave climatically like a zone one category away from the hills above it.