

Key Takeaways
What Is Sea Level Rise?
Sea level rise refers to a long-term increase in the average height of the world's ocean surface relative to the land. Scientists distinguish between two types: global mean sea level, which averages measurements across the entire ocean, and relative sea level, which is what residents of a particular coastline actually experience and which can be higher or lower depending on local land movement.
Over the 20th century, global mean sea level rose at an average rate of about 1.5 millimeters per year. Since the early 1990s, that rate has roughly doubled to approximately 3.7 millimeters per year, according to data from NASA and the National Oceanic and Atmospheric Administration (NOAA). In total, global sea level is now estimated to be about 8-9 inches (21-24 cm) higher than it was in 1880.
Understanding why that acceleration is happening - and where the trend is headed - requires looking at the physical mechanisms driving it.
The Two Main Causes: Ice Melt and Thermal Expansion
Sea level rise has two dominant physical causes, each contributing roughly equally to current totals.
Thermal Expansion
Water expands in volume as it warms - a property called thermal expansion. As the ocean absorbs the excess heat trapped by greenhouse gases, it physically swells. The ocean has absorbed more than 90% of the excess heat generated by human-caused warming since the mid-20th century, and this expansion now accounts for roughly 40-50% of observed sea level rise.
Melting Ice
The remainder comes primarily from melting land-based ice. The Greenland Ice Sheet and the Antarctic Ice Sheet together hold enough frozen water to raise global sea levels by more than 200 feet if they melted entirely - a scenario that is not projected over any near-term timeframe, but their accelerating mass loss is significant. Mountain glaciers worldwide are also shrinking and collectively contribute a measurable share. Importantly, floating sea ice (like Arctic sea ice) does not raise sea level when it melts, for the same reason a melting ice cube doesn't overflow a full glass.
When evaluating sea level risk for a specific location, always look at relative sea level data - not just the global average - because local land movement can be the dominant factor in real-world flood exposure.
Tide gauge records show that some U.S. cities face effective sea level rise two to three times higher than the global mean purely because the land beneath them is sinking, independent of ocean changes.
Treat the low end of IPCC sea level projections as a planning floor, not a likely outcome - infrastructure designed only around median projections carries meaningful residual risk.
Ice sheet dynamics remain one of the largest sources of uncertainty in long-range projections; conservative engineering standards typically account for tail risks that probabilistic midpoints underweight.
How Scientists Measure Sea Level
Accurate measurement is foundational to understanding sea level trends. Scientists use two complementary approaches.
Tide Gauges
Tide gauges are instruments mounted at fixed coastal points that record the height of the ocean surface relative to a local benchmark on land. Some stations have continuous records stretching back more than a century, making them invaluable for long-term trend analysis. Their limitation is that they measure relative sea level - they can't distinguish between a rising ocean and a sinking shoreline.
Satellite Altimetry
Since 1993, a continuous series of satellite missions - including TOPEX/Poseidon, Jason-1, Jason-2, and Sentinel-6 - has measured the absolute height of the ocean surface with millimeter-level precision by bouncing radar pulses off the water. This technology provides a truly global picture unaffected by local land movement. You can learn more about the broader infrastructure behind these measurements in our article on how climate data is collected.
What the Projections Actually Say
Projections of future sea level rise are generated using climate models and depend heavily on how much greenhouse gas humanity emits going forward. The Intergovernmental Panel on Climate Change (IPCC) Sixth Assessment Report (AR6), published in 2021, provides the most current scientific consensus.
Under a low-emissions scenario (roughly consistent with ambitious climate policy), global sea level is projected to rise approximately 0.3-0.6 meters (1-2 feet) by 2100 relative to 1995-2014 levels. Under a high-emissions scenario, the likely range is 0.6-1.0 meters (2-3.3 feet), with a small but non-negligible possibility of exceeding 1.5 meters if ice sheet dynamics prove more unstable than current models capture.
3.7 mm/yr
Current rate of global sea level rise
According to NASA satellite altimetry data, the current rate is roughly double the 20th-century average.
~9 inches
Total rise since 1880
NOAA estimates global mean sea level has risen approximately 21-24 cm since reliable records began around 1880.
2-3×
Increase in U.S. high-tide flooding events
NOAA data shows nuisance flood days have increased two- to threefold in many U.S. coastal cities since 2000.
Beyond 2100, projections carry greater uncertainty - but the IPCC notes that sea level rise is effectively irreversible on human timescales due to the slow response time of ice sheets and deep ocean heat. Even if emissions halted today, sea level would continue rising for centuries.
Regional Variation: Why Some Coasts Are at Greater Risk
The global average masks significant regional differences. Several factors cause local sea level to diverge from the global mean:
- Land subsidence: Many coastal cities are built on compressible sediment, and groundwater or fossil fuel extraction accelerates sinking. Parts of Houston, New Orleans, and Jakarta are subsiding at rates that exceed global sea level rise, dramatically worsening their effective exposure.
- Glacial isostatic adjustment: When massive ice sheets melt, the land that was depressed beneath them slowly rebounds - while land farther away, previously tilted upward, subsides. This affects much of the U.S. East Coast, which is gradually sinking as a result of ancient ice sheet dynamics.
- Ocean circulation changes: Shifts in major ocean currents, including a potential slowdown of the Atlantic Meridional Overturning Circulation (AMOC), can cause sea levels to pile up along certain coastlines independent of total ocean volume.
What This Means for Coastal Communities
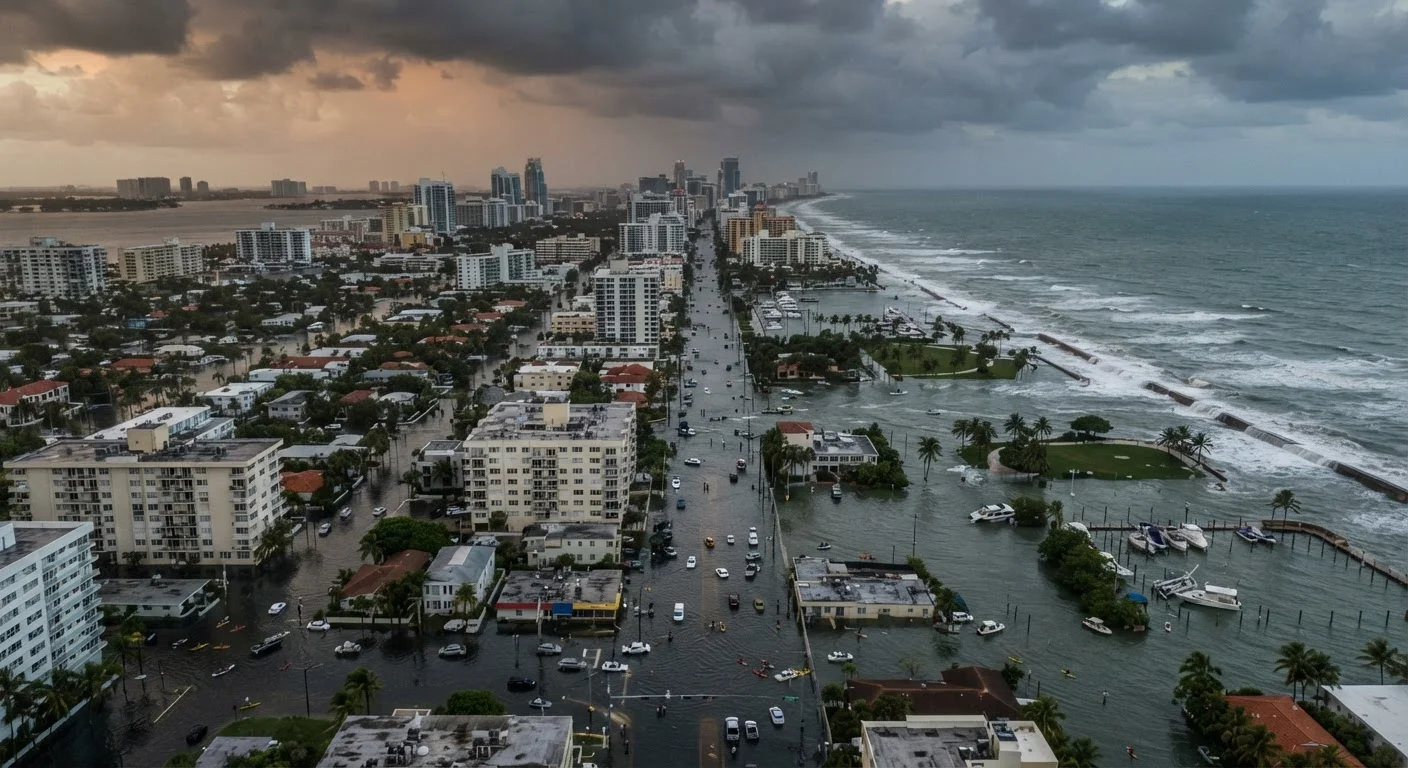
Even modest increases in baseline sea level have disproportionate effects on flood frequency. A small rise can turn what was once a rare 1-in-100-year flood event into something that occurs every decade - or every year. NOAA's data already shows that high-tide flooding (nuisance flooding that disrupts roads, businesses, and stormwater systems even without storms) has increased two- to threefold in many U.S. coastal cities since 2000.
Storm surge from hurricanes and nor'easters rides on top of whatever the baseline sea level already is, meaning a higher baseline amplifies the inland reach and destructive power of every major storm. This is not a future abstraction - it is an observable, measured shift affecting coastal infrastructure planning, insurance markets, and property values today.
Scientists are clear that uncertainty in the upper end of projections is not grounds for inaction: the lower end of likely projections still represents substantial change, and planning for coastal resilience is most effective - and least costly - when begun well in advance.
This article presents general scientific information based on published research and should not be used as the sole basis for infrastructure, insurance, or property decisions. Consult qualified professionals and official government sources for guidance specific to your location.